
Effects of Ground Winds - Aerodynamic Decelerator Systems Laboratory
Effects of the Ground Winds
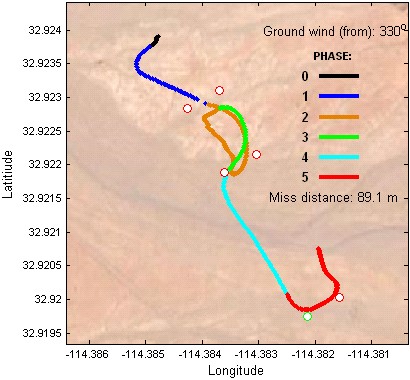
Obviously, it is the ground wind that affects touchdown accuracy the most. With a perfect knowledge of the winds, Snowflake (as any other ADS) would land almost exactly on target. Unfortunately, the only winds available onboard are the wind estimates, provided by the GNC algorithm in real-time. For the Snowflake ADS the last estimate of the wind magnitude comes at the end of the downwind leg, i.e. the construction of the base-turn maneuver relies on this last update obtained at an altitude of about 100m above the ground level (AGL). If the winds below 100m are the same as (correctly) estimated at 100m then the system would land in a close vicinity of the intended point of impact (IPI). Of course, having the same winds throughout the last 100m of the guided descent is rarely the case (if ever at all). For Snowflake, this problem was fixed having a networked target weather station broadcasting the ground winds to the gliding ADS allowing to model the surface layer winds more accurately. For educational purposes however, let us consider a couple of airdrops when the last wind estimate at 100m was the only available piece of data. The key in this case is how accurate the estimate of the wind was and how much of a wind change the ADS had to face on its final 100m altitude to the ground.
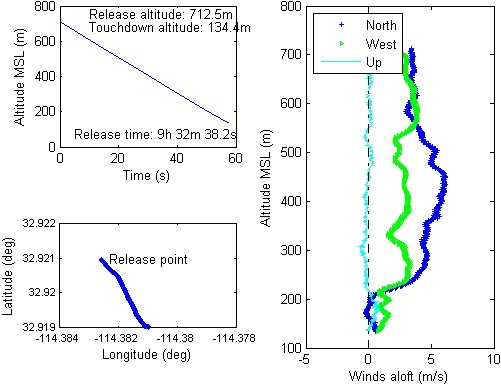
Figure J shows a bird-eye view of two airdrops, a "bad" one (left) and a "good" one (right) with the time difference between them being slightly over one hour.
 |
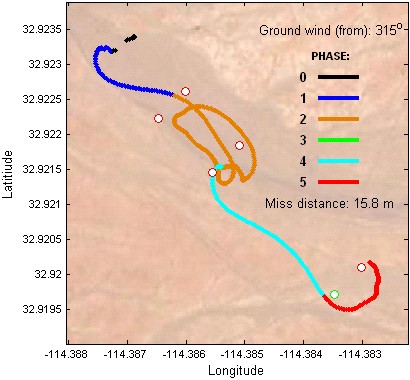 |
Figure J. Bird-eye trajectories of the two Snowflake airdrops (October of 2008) exhibiting different touchdown performance.
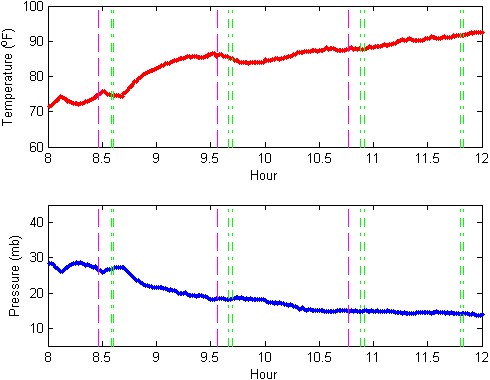
Figure K presents data collected continuously by the wind tower for post-test analysis. First, one can observe the drift in the barometric pressure that the estimates of the ADS height above IPI are based upon. As seen, the onboard barometric pressure sensor settings have to be changed constantly to accommodate these changes in the ground pressure. Failure to do that results in ADS thinking that it is higher / lower AGL than it actually is (because the barometric pressure varies throughout the day). Second, during the four sets of airdrops executed that day, the winds did change direction and magnitude. Starting with the light (less than 1m/s) variable-direction winds in the morning the ground winds became more consistent (in the wind direction) but stronger (up to about 4m/s) at noon.
 |
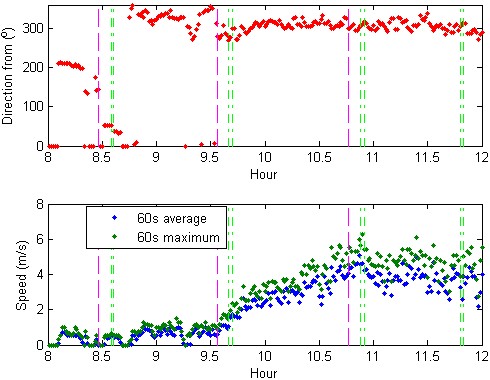 |
Figure K. Wind tower data with the vertical lines indicating multiple double Snowflake releases.
Next, Fig.L presents the wind data also collected for post-test analysis by Windpack dropsondes deployed a couple of minutes before each first (in a set of two) ADS release. In this figure they are presented as recorded by the Windpack dropsondes, where altitude is provided with respect to the mean sea level (MSL). As seen from this figure, during the last 100m of altitude the winds do change and that is what affects the touchdown error. Figure M addresses this issue in more detail, providing a comparison of Windpack dropsonde data with that of the wind tower and Snowflake estimates. (In this figure, the Windpack altitude data are converted from MSL to AGL; and the Snowflake ADS altitude data are corrected to accommodate the altitude estimates errors, i.e. all data are altitude-synchronized.)
 |
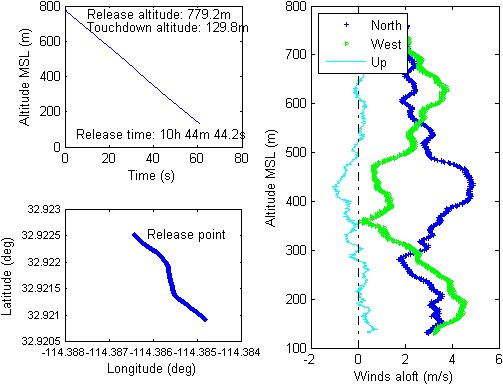 |
Figure L. Windpack data for the "bad" (left) and "good" (right) airdrops.
 |
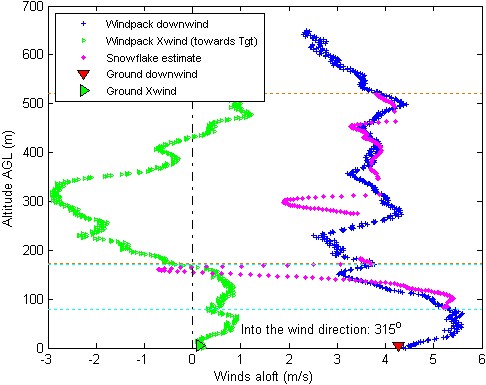 |
Figure M. Windpack data versus Snowflake estimate for the "bad" (left) and "good" (right) airdrops.
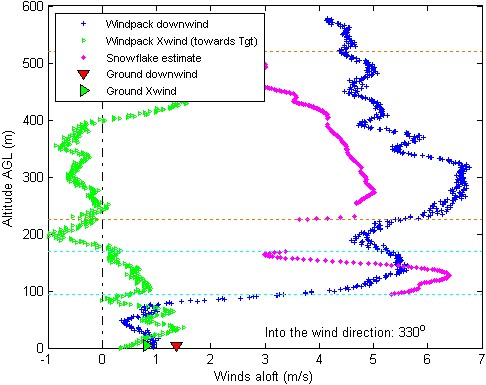
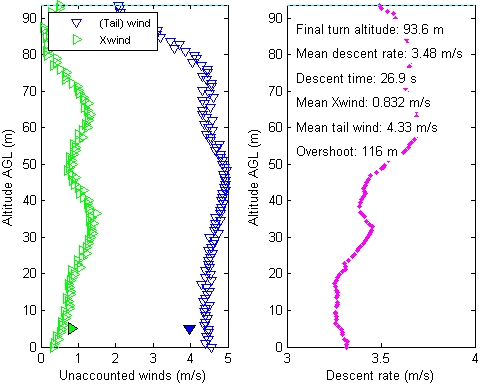
Figure N presents even more detailed analysis of data shown in Fig.M, concentrating on the last two phases of guided descent, the final turn to the target and final approach. The left portion of each plot shows the difference between the tailwinds predicted by Snowflake and actual winds measured by Windpack dropsondes, and the crosswind component that the ADS had to overcome on its way down. On the right portion of each plot the vertical speed as recorded by the Snowflake ADS barometric altimeter is also presented. Several calculated parameters shown on these plots represent a rough estimate of contribution that the winds, unaccounted for in the downwind direction, might have on overshooting IPI.
 |
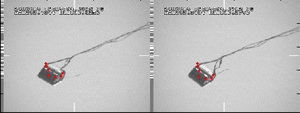 |
Figure N. Downwind and crosswind components of the unaccounted winds for the "bad" (left) and "good" (right) airdrops.
Consider Fig.Ma. As seen, the last estimate of the along-the-course wind component by the Snowflake autopilot occurred at about 93.6m corrected altitude AGL and provided the value of 5.3m/s. However, the real winds had suddenly died decreasing to only about 1m/s all way down to the ground. Hence, there is a 4m/s difference between the last Snowflake estimate and the actual winds (Fig.Na) all way down. These unaccounted for tailwinds that acted during the last 27s of the guided descent should have resulted in a large system overshoot of about 116m. Luckily, because of the 15.5m error in the altitude estimate the actual miss distance happened to be smaller.
Now, consider Fig.Mb. Compared to the previous case, the wind estimate at the corrected 79m altitude AGL is almost perfect (5.2m/s) and the winds do not change much during the final turn (Fig.Nb). This should have resulted in landing about 1.4m short of IPI. Yet, again, because of the ~8.2m error in altitude the actual touchdown point happened to be 5m short of IPI. Data for these two Snowflake airdrops are consolidated in Table A. This table shows upwind components of miss distance and then analyses a possible contribution of the two sources of error, which are the altitude estimation error and winds unaccounted for during the last two phases of the gliding descent. The last column shows the values of miss distance that could be achieved if both errors were eliminated.
Table A. Estimates of possible causes for over- / under-shooting IPI.
Table A. Estimates of the possible causes for over- / under-shooting IPI.
| Drop | Upwind component of miss distance, m | Altitude error, m | Correction due to the altitude error, m | Correction due to unknown winds, m |
Estimated upwind miss distance, m |
|
“Bad” |
102.13 | 15.50 | 31.00 | -116.00 |
17.13 |
| “Good” | -5.11 | 8.23 | 16.46 | -1.44 | 9.91 |
Once both sources of errors were eliminated (in the Snowflake-N version) the exhibited performance matched these expectations (of having touchdown accuracy below 20m) fairly well.