
Finding Reference Points - Aerodynamic Decelerator Systems Laboratory
Finding Reference Points
After normalizing (stabilizing) all the images, the frame coordinates of all (visible) surveyed reference points on each frame can be found. Figure G presents a combined output of the developed algorithm showing all major steps, while Figs.H-K repeat each plot shown in Fig.G using a larger scale. Staring from the original image (Fig.H and the top left plot in Fig.G) the algorithm proceeds with splitting it into three color components (RGB) and plotting the contour map of intensity for one of components. It should be noted that the reference points appearing white produce the highest intensity in each of three components, so that any component could be used in further analysis. However, it turned out that red and blue components exhibit a more robust behavior.
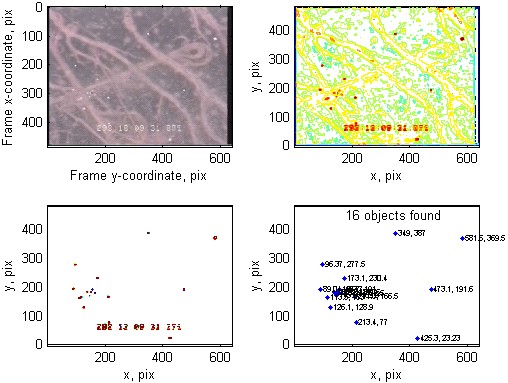
Figure G. Analyzing a single frame.
The contour map for a blue component appears on the top right plot of Fig.G (Fig.I). Algorithm further finds the average intensity and a standard deviation (sigma) for the entire frame. The previously computed contour map is then corrected by subtraction of an average plus two sigma from each pixel. The results are shown on the bottom left plot of Fig.G (Fig.J). Further correction involves getting rid of the time stamp and finding the centroid of each group of the remaining pixels representing the surveyed reference points. The final results are shown on the bottom right plot of Fig.G (Fig.K). The (u,v) coordinates of each surveyed reference point are also shown for convenience (they are available in the digital format for further processing as well).
As seen, for this specifically chosen sample of video data with almost invisible (even by a naked eye) pop-up points, the straightforward algorithm does not detect them as easy as the surveyed reference points. However, if the area where the popped-up points is localized and the corresponding transformation is found (like shown in Fig.F), then the popped-up spots are easier to detect with respect to the intensity of surrounding pixels. In practice, for a high-quality video, even this straightforward algorithm assures finding not only the surveyed reference points, but the popped-up points as well.
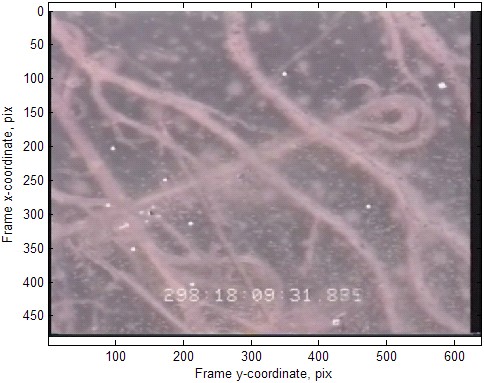
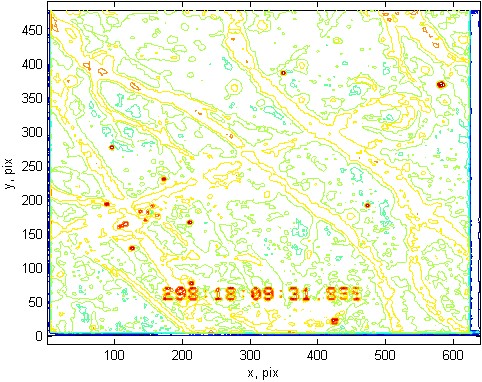
Figure H. Original image. Figure I. Intensities of blue component.
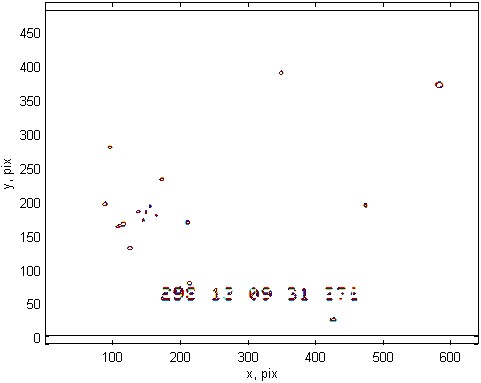
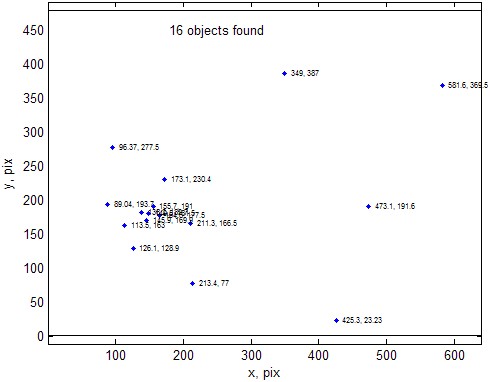
Figure J. Finding the peak intensity spots. Figure K. Finding the surveyed reference points.