An international team of scientists and glaciologists are reaping the data-rich rewards of an exhaustive expedition to the Western Antarctic Ice Shelf’s (WAIS) Pine Island Glacier, where landmark measurements of ocean/ice interactions are beginning to clarify what experts have long called “the biggest source of uncertainty in global sea level projections.”
Naval Postgraduate School (NPS) Department of Oceanography Research Professor Tim Stanton and University of Alaska Department of Physics Professor Martin Truffer led the team to the remote edge of the Pine Island Glacier’s massive shelf. And the results of their expedition are giving scientists a rare look beneath the ice at one of the most critical research sites on the planet – a site whose fate could affect the lives of millions.
Stanton and Truffer have been working for years with colleagues from Pennsylvania State University, NASA, the British Antarctic Survey, and New York University in an effort, funded primarily by the National Science Foundation, to detail exactly what is happening beneath the Pine Island Glacier.
The accelerated flow of glacial ice from Antarctica’s WAIS into the Amundsen Sea has been a concern of scientists since the late ‘80s. But as warm sea water flows along the ocean floor toward the grounding line, where the massive glacier and land meet, the resulting boundary layer current heads back out to sea along the underbelly of the glacier, carving a series of melt channels along the way.
In late 2012, after years of planning, missed opportunities, and uncooperative weather, the team was able to deploy one-of-a-kind sensors and profilers designed and built by Stanton through the 450-meter ice shelf. The resulting data sets are revealing, for the first time, exactly how much ice is melting beneath the massive glacier, one that is estimated to contribute an astounding seven percent to overall global sea level rise.
“Fresh water forms every time [the sea] injects heat into the shelf,” explained Stanton. “The warm water starts to melt the ice at the grounding line and creates a plume called a boundary layer current. We measured the effects of that current for the first time.
“There were basically three scientific activities performed at the Pine Island Glacier sites … Our instrumentation packages underneath the ice shelf, dual seismic and radar mapping by Penn State, and the British Antarctic Survey group’s radar survey,” said Stanton.
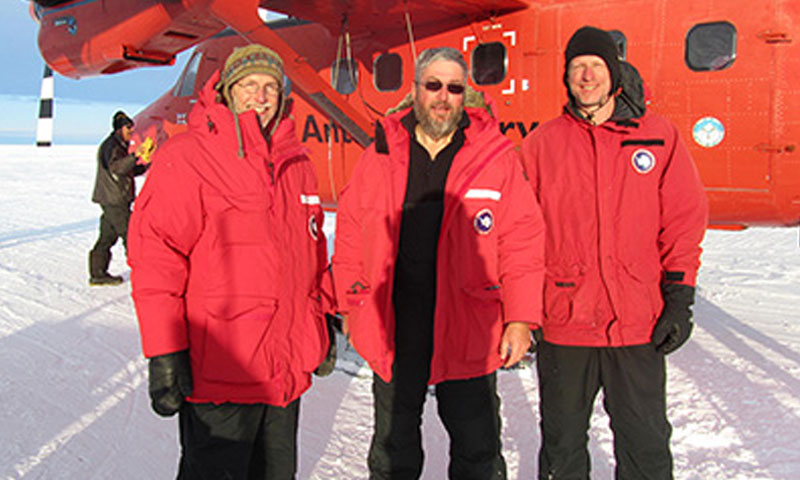
Jim Stockel, Tim Stanton and Bill Shaw (Naval Postgraduate school) arrive at the Pine Island Glacier drill camp by Twin Otter.
Together, these activities reveal a detailed picture of glacial ice melt beneath the shelf, stripping away the glacier’s bottom at a rate of approximately six centimeters per day, Stanton said.
The Pine Island Glacier truly is one of the most remote locations on the planet, and conducting research at the end of the world was no easy feat. Stanton’s field site was located 1,800 kilometers from McMurdo Research Station, a small but surprisingly well-appointed facility that provides welcomed support to various research efforts on the southern continent. Once you depart McMurdo, however, sub-zero temperatures, snowstorms, and ice as far as the eye can see, pose enormous logistical challenges, but even they might be overshadowed by the research site’s remote location.
“Working out of McMurdo to do research on Pine Island is like sitting in Seattle and trying to do field work in Minnesota with nothing in between,” said Truffer. “It was an incredible physical challenge trying to get out there, we had done nothing before on this scale.”
NPS oceanography Assistant Research Professor William Shaw has been working on the NPS portion of the project since its inception, and has traveled to the remote site twice in the last two years.
“You are in an open area with nothing around for thousands of miles but ice … sleeping in small backpack size tents,” said Shaw.
“There was not a single thing that we ate that hadn’t expired years ago,” added Stanton.
There were also years of setbacks prior to the successful deployment of the team’s equipment, which Truffer reluctantly describes as a “season of learning.”
But in December 2012, all the pieces fell into place. The team’s equipment reached McMurdo by vessel, and was then flown by a ski-equipped C-130 Hercules to a staging area, then transported via Twin Otter aircraft to the ice shelf – a trip of more than 1,100 miles. Once on the shelf, the equipment was packaged aboard snowmobiles and trekked to pre-selected drill sites.
Logistical headaches aside, Stanton and Truffer note that detailed data of the ocean/ice interactions beneath the Pine Island Glacier specifically have been on glaciologists’ wish lists for decades. Dr. Terry Hughes with the University of Maine underscored the importance of the Pine Island Glacier in 1982 when he refereed to it as “the weak underbelly of the West Antarctic Ice Sheet.”
Truffer became involved in the Pine Island Glacier project after previous observations of warm water glacial melting in the Arctic and his past ice-drilling expertise.
“The science excites me … Ten years ago we looked at this issue of glacier melting from oceans at several places. We looked at a glacier in Alaska where there was very warm, 45-degree water in front of a glacier and determined that this is a big part of how ice is lost. We then went to Greenland, where we saw 15 kilometers of glacier front lost in three years due to warm water flowing underneath,” said Truffer.
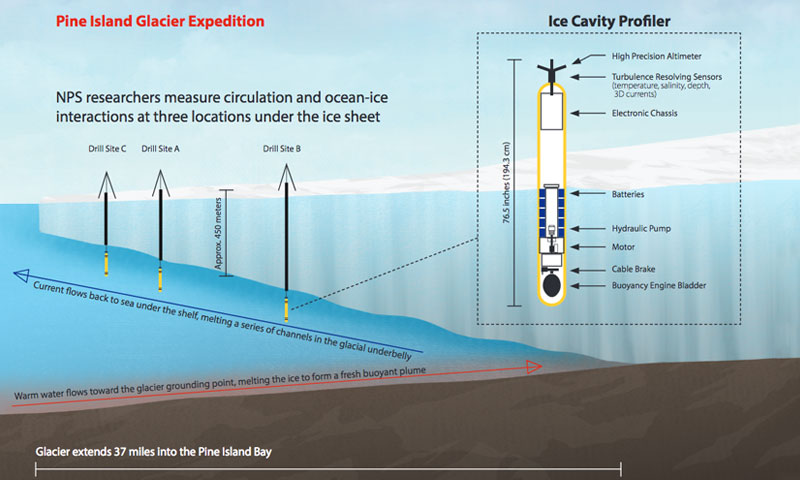
Click here to open a PDF image of the Pine Island Glacier Expedition diagram.
While previous research detailed the processes that were believed to be occurring beneath the Pine Island Glacier, Stanton and his team needed precise measurements. He selected what he believed would be three ideal sites to measure basal glacial melting, where boundary layer currents had carved channels beneath the ice shelf.
“We wanted to be able to measure the currents and turbulent exchange within one of these channels and then use radar measurements across the structure to compare melt rates,” said Stanton.
“There is no one measurement that gives us all the answers,” he continued. “What we have brought to the table are detailed measurements of melt rates that will allow simple physical models of the melting processes to be plugged into computer models of the coupled ocean/glacier system. These improved models are critical to our ability to predict future changes in the ice shelf, and glacier melt rates of the potentially unstable Western Antarctic Ice Sheet in response to changing ocean forces,” continued Stanton.
Stanton’s measurements were made possible by the successful development and deployment of his Ocean Flux Profiler and Fixed-Depth Ocean Flux Package sensors.
“We developed a specialized suite of ocean instrumentation that could sample turbulence and lateral transport rates in the ocean cavity, and autonomously offer two-way communication of data and sampling commands over yearlong sampling periods,” said Stanton.
But to get those results, Truffer had to bore through nearly 500 meters of solid ice to create a pathway by which the instruments could be placed beneath the glacial shelf, and they had to do it quickly before the holes froze back up.
“We used a ‘so-called’ hot water drill. We started out by melting about 1,000 gallons of snow, and then heated the water and started pumping it into our hole in the ice,” said Truffer. “Utilizing this process, we were able to drill boreholes at three sites. When we started out we did not believe we would be able to do more than two sites in a single season.”
Once the instruments were deployed, and the boreholes froze over, the sensors were anchored to the bottom of the shelf.
“The idea that we were able to drill through 500 meters of ice and then deploy our sensors through the hole that we had made was remarkable,” said Shaw.
The sensors measured details such as salinity, ocean water turbulence and ice thickness data, which were transmitted back to NPS for analyses.
Click here to visit NPS' Pine Island Glacier news page to learn more about the project, read blogs penned by Tim Stanton and other project scientists, and find links to additional news stories and related websites.
“We were essentially measuring the salt flux and the little turbulent eddies that occur within the current … We could integrate these findings over time, by adding up the salt flux and the basal retreat. Using these two methods allowed us to get at the melt rate,” said Stanton.
“It was very challenging building instruments that gather this data, and were small enough to go down the boreholes. This was the most challenging field program I have ever done, but we are very pleased with the results,” he added.
Shaw compares the eddies beneath the ice to an inverted river flowing along the underside of the ice shelf. “It's a lot like a river system, but instead of eroding its surroundings, it melts them,” he said.
“The objective is to know how fast [the ice] is melting now, but also to understand how much heat is coming in. Without these measurements, we would be unable to determine precisely how [warm seawater] is affecting actual melt rates,” added Stanton.
“We now know how much heat is getting under the ice shelf and how much it is melting glacial ice. As it melts, it is lifting up the ice shelf, allowing water go in even further, resulting in the grounding line lifting up,” said Stanton. “As you lift it up, you reduce the drag on the ice shelf allowing the ice to flow more quickly down from the ice sheet.
“Pine Island Glacier is a principal outlet of WAIS that has rapidly thinned, retreated, and accelerated. The spatial pattern of thinning suggests that the glacier drawdown is the direct result of increased basal melting of the ice shelf that has reduced its buttressing effect,” Stanton explained.
The buttressing, or friction, of the ice shelf’s lateral contact with land or slow-moving ice keeps the seaward movement of glacial systems in check, ultimately creating an overall equilibrium where glacial ice fills in the rear as the front of the glacier slowly melts into the ocean and occasionally breaks off into large icebergs.
The measured glacial melt rate at the site, and through the channel on Pine Island, at approximately six centimeters per day, reveals a critical need to understand channelized melting underneath these massive glaciers, as they are major contributors to global sea-level rise now, and are expected to be so into the future.
And there is a more ominous potential outcome as well. As the grounding line continues to retreat into an ever-deepening basin, more ice is exposed to melting by the warm ocean water, and the ice flux towards the sea will increase as well. This has major societal implications as this part of the ice sheet by itself holds enough water to raise global sea level by more than one meter.
While the potential of losing the entire Pine Island Glacier is remote, it may not be nearly as remote as the research site itself, where the team is already developing plans to return and continue their research. As scientists continue to detail the precise melting rates below Pine Island Glacier and similar sites, advanced understanding of these massive systems, and their overall impact on sea levels, become increasingly clear.